How to Use Data for Innovation

Data can be a powerful tool for innovation, but it can feel daunting to figure out where to start. Whether you’re overwhelmed with data or needing more, it's hard to know what's relevant to the problem you're trying to solve, confidently interpret the data, and navigate toward innovative solutions. The good news is, you don’t have to be a data scientist to tap into the power of data.
In this episode of the Creative Confidence Podcast, Bo Peng, an instructor of IDEO U’s course Innovating with Data and Senior Portfolio Director of Data Science at IDEO, shares how to use data to uncover opportunities for innovation and better understand people and problems—including the first thing you should do before any data analysis, strategies and tools for pinpointing your challenge and determining the data you need, and a mindset shift that will help you uncover insights in your data.
Different Types of Data
When we're thinking about data, what do we mean? People often think of tables and spreadsheets, but there are many different types data:
- Qualitative data: Includes text transcripts of audio recordings from field interviews, videos taken on cameras or phones, observations from design research in the field
- Quantitative data: Includes things that can be represented with numbers or a series of numbers, such as revenue over time, the number of people that visit a website, the length of time spent in the store
A Human-Centered Approach to Data
At IDEO, we take a human-centered approach to using data. Bo says that there are five principles for innovating with data, the most important of which is that data is created by humans. Behind every data set, there are human architects—people who decide what to measure, what not to measure, and how to measure it. And oftentimes, humans are the ones doing the collection of that data. Data may look like some objective truth when you see it in a database on a screen, but it actually comes from a very human process.
That allows us to think more creatively about how to use data, particularly in the early stages of innovation, because we start to think about the contexts in which the data is collected, the systematic biases that the data might inherently have, and how to design around that. If the data points collected represent human behaviors from real people, we can start to imagine and empathize with those human stories behind the data.
When you think from a human-centered lens, it can help you design better products and services for people. Rather than just looking at data to validate ideas in the very last stages or to measure the effectiveness of ideas, this perspective empowers us to use data earlier on. Bo says that data can help us brainstorm, ideate, and think about new concepts. It can inspire us to come up with big ideas and opportunity areas from the get-go.
“Think about the human stories behind the data.”
Bo Peng, Innovating with Data Instructor and Senior Portfolio Director at IDEO
How to Get Started with Using Data
According to Bo, the best place to start with using data is with a designer's mindset, and making sure you know what the right problem to solve in the first place is—which can be a big task. When innovating with data, a lot of people will start with the data, whether it’s thinking about what to collect or digging into existing data. Bo suggests starting with the problem at hand and not even looking at the data at first. Instead of immediately trying to optimize for numbers like revenue and engagement, it's important to ask the why behind the problem, because oftentimes an initial problem statement presupposes a solution with it.
Bo gives the example of IDEO’s work with a company that provides a digital service, including a mobile app and wearables, that helps you sleep better. At the time, they were focused on helping elite athletes get a good night's sleep, especially the night before games. Initially, the company asked IDEO for better charts and graphs on their app because they thought that if the athletes could see more information, then it would help the athletes make those more informed choices and lead to app stickiness.
Bo focused on understanding what the athletes needed first, and the team’s design research actually showed that charts and graphs weren't the sticky or impactful part, just where they had the most data. They found that athletes wanted more human connection behind the app and wearable experience—they wanted an accountability buddy and coaching, not just better charts and graphs. As a result, they decided not to make the data visualizations a central part of the app, and instead added chat and other communication features to create a more human touch.
If you want to learn more about using data to uncover opportunities for innovative solutions, check out our online course Innovating with Data, where Bo is an instructor.
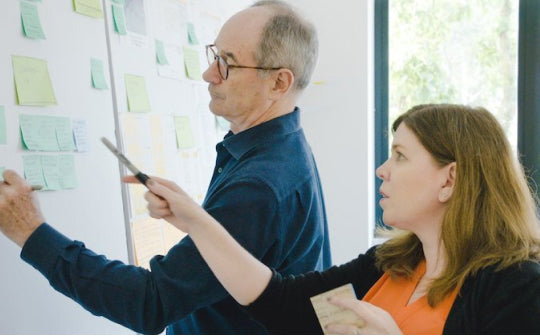
A Tool for Innovating with Data: Sketching
Sketching with the end in mind is a strategy can help you imagine future possibilities with data. Bo shares the example of IDEO’s work with Proctor & Gamble, which wanted to connect 20,000 of its researchers, scientists, and engineers across the world with a tool. Instead of starting with the data, Bo began by sketching with the end in mind. Bo imagined what the end product might look like, sketching out potential screens and product flows. The team presented several sketches as options to the client to get their reaction, before even knowing what the data would be.
They imagined many different interfaces for connecting people in different ways. One of them looked like a Facebook wall, while another looked like a network diagram with nodes and edges. Throughout the process, the client shared what they liked and didn't like, so they could quickly figure out what kinds of interfaces to work toward. The responses to these sketches would later influence what data they collected and what methods to build on the backend, such as statistical methods or machine learning algorithms.
Sketching early on saves time by giving a clear direction before diving into any data collection or analysis. It’s powerful to think about what the problem is in the first place because ultimately, you want to create a solution that solves the right problem, rather than just using any kind of data to solve a problem that may or may not be the right problem to solve in the first place.
“It’s tempting to start with your data. But it’s so powerful to think about what problem you’re solving for in the first place.”
Bo Peng, Innovating with Data Instructor and Senior Portfolio Director at IDEO
Getting Insights Out of Data
In a data context, a lot of people think of insights as solely whatever the data happens to look like. For example, if there’s an upward trend, the insight is that the numbers are going up. While sometimes that's true, insights are not just observations of the data by itself. Bo thinks of insights as discoveries of patterns that offer new perspectives.
We use insights to inspire new ideas and unlock opportunities to design new products and services to improve the way that people live. When we develop an insight, that insight can sometimes change how we see the world, like how we think, how we feel, and how we act. It’s part art, part science, and when you get it, it's like the “aha moment” of discovering something that then also guides you.
One approach to insights: Look for outliers in the data
Bo shares one approach to finding insights that she teaches in her course, which is to look for outliers in the data. When you have a series of quantities, outliers are quantities that are way higher or way lower than most of the others. Say you're a museum director looking at time spent in your museum. Let's say the average visitor of your museum might spend two to three hours there on average. An outlier would be a visit that's either really short, like a minute, or really long, like eight hours from open to close.
You could start to dig into why those really short or really long visits are happening. For the people who are staying for only a minute, what's going on there? Are people walking into the building by mistake? If that’s the case, there could be an opportunity to improve signage. For the really long visits, you can look into what the people who stay there all day are doing. How do they have the time, what contexts do they live in, and how are they experiencing that museum that might be different than the average visitor?
As another example, Bo talks about a company that IDEO worked with that wanted to develop a new frozen meal. The team did interviews with a variety of people, and most purchase behaviors were what they expected. But there was one interesting home visit in which they observed a professional single working woman in her forties who lived alone, with no kids. They looked in her freezer, and in her freezer was a stack of kids frozen meals. It was something they hadn’t seen before, and they got curious about her purchasing behavior.
When they asked her, she said that she was busy and didn’t have time for cooking, which was the same as other people that they interviewed. But she said that she bought frozen kids meals because she thought that nobody would serve an unhealthy meal to children, so they’d be healthier. The team realized that this was an opportunity area, and they were able to design a product that markets healthy frozen meals to professional working adults.
In more traditional data analysis, often you'll take a look at the outliers and then cut them out. You might see them as a fluke or an error in the data recording. That could still be true, and it's important to do due diligence first. But when you're designing with data, it's often interesting to look at the outliers and ask questions and get curious about why certain data points are so different from the rest.
“When we’re talking about the innovation process, often people see data as a method for validating after the fact. But data can help with brainstorming and creating new concepts—it’s really helpful in all parts of the innovation process.”
Bo Peng, Innovating with Data Instructor and Senior Portfolio Director at IDEO
About the Speaker

Bo Peng
Senior Portfolio Director, Data Science, IDEO
Bo works at the intersection of data science and human-centered design, and is passionate about using data as a resource to improve the way we work, play, and think. She co-leads IDEO’s data science practice. Prior to IDEO, she was a partner and data scientist at Datascope, a cutting-edge data science consultancy based in Chicago. Bo led a series of engagements with deep technical expertise, including partnering with P&G to systematically surface subject matter experts and collaboration opportunities, and with Steelcase to prototype the next wave of smart workplace and employee engagement tools. Bo holds an MS in Statistics and a BS in Mathematics from the University of Chicago and was named one of Crain's 2019 Tech 50.
Want to hear from more creative leaders and experts? Subscribe to IDEO U’s Creative Confidence Podcast.


- choosing a selection results in a full page refresh
- press the space key then arrow keys to make a selection